596-SURF
241-SURF(KAUAI)
922-BONG
Home
Surf Report
10 Days Forecast
Pat Caldwell
Big Picture
Islands
Oahu
Sunset Beach
Rocky Point
Pipeline
Chuns
Laniakea
Haleiwa
Makaha
Ewa Plains
Ala Moana Bowl
Waikiki
Diamond Head
Sandys
Makapu u
Big Island
Hilo
Hamakua Coast
Kohala
Kona
Puna
Maui
Ho okipa
Honolua
Lahaina
Kihei
Hana
Kauai
Hanalei
Majors
Poipu
Kapaa
Models
La Jolla Surf
Webcams
Premium
All Webcams
North Shore Cams
South Shore Cams
Webcams Archives
Webcams Shots
Indicator
Sunset
Pipeline
Laniakea
Chuns
Ala Moana Bowls
Kaisers
Paradise-Threes-Kaisers-Rockpiles-Ala Moana Bowl
Waikiki Walls-Tonggs
Diamond Head
Tides
Oahu
North
West
South
East
Maui
North
West
Kauai
East
North
Big Island
East
West
Weather
Weather & Warnings
Forecast Discussion
Animations
Precipitation
UV Index
Glossary of Weather Terms
Buoys
CDIP Buoy/Forecasts
SNN Buoy Layout + Spectral Snapshots
National Buoy Center
News
Community
Surfer’s Wall
My Account
My Membership
Log In
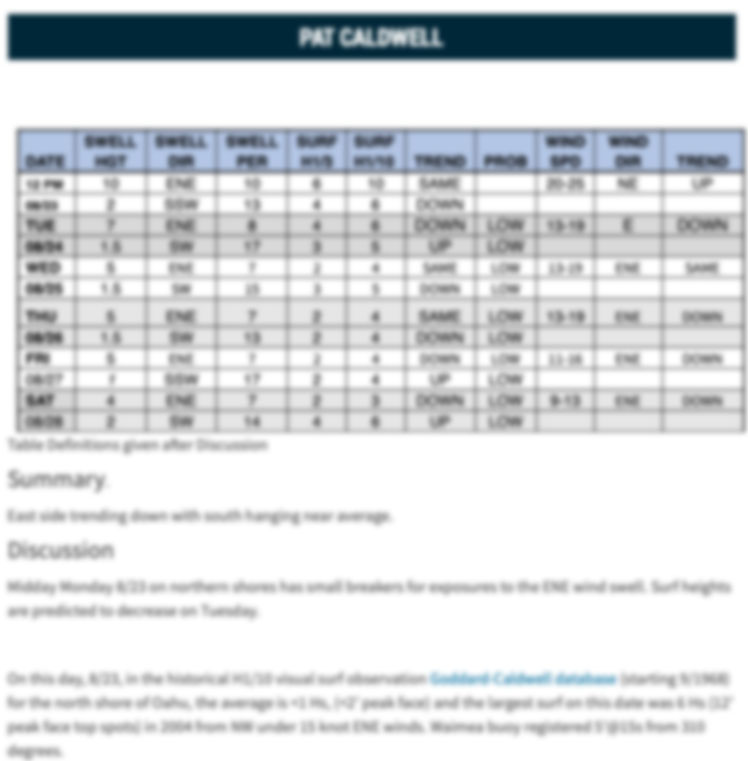
PAT CALDWELL
Aloha! Pat Caldwell is now a premium feature. Non-premium users can access Pat Caldwell on Mondays only.
Sign Up Now!
or
Log In
Aloha!
You must be logged in and be a
Premium Member
to view the Pat Calwell
Upgrade Now!
Surface Chart
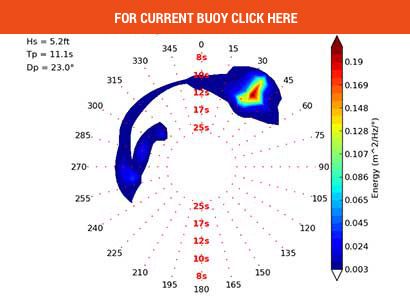
Waimea Buoy
Barber Pt Buoy
‹
›
Sponsors
×
Close
Swell Tracker
×
Close
Surface Chart
×
Close
Waimea buoy
×
Close
Barbers Point
Back to Top